SACRAMENTO, Calif. — Every 10 years new Climate Normals are released from the National Oceanic and Atmospheric Association (NOAA) and the National Centers for Environmental Information (NCEI). The May 4 release will include data from 1991-2020. This will be the update from the last set of 30-Year Normals from 1981-2010.
The new Climate Normals will change with this new cycle but since two-thirds of the periods overlap, we may not see huge changes. Right now, NOAA and NCEI are saying we may see many parts of the United States see fewer ‘above normal’ temperature days at the start of this decade compared to recent years.
History: The World Meteorological Organization (WMO) created the first 30-year average in 1935 using 1901-1930 as the time frame. By this time, most countries had at least 30 years of data collection to make accurate calculations. Updates have been made by most countries every 10 years. In 2015, the WMO made updates every 10 years standard so we will be seeing updated Climate Normals for 1991-2020 from all over the world.
Importance: 30-Year normals serve as a significant baseline for many decision-makers. This data helps plan for electricity load, building heating/cooling requirement calculations, construction scheduling, agriculture decisions and other sectors of the economy.
Process: This is not just simple averages. The NOAA and NCEI Normals Team use more complicated sets of calculations to offset some of the anomalies. For example, stations moving locations or missing data. For this newest release with data from 1991-2020, NOAA and NCEI are keeping the same methodology. They are also improving how they round, calculate percentiles, count days exceeding thresholds and format output.
New This Year: The new 30-Year Normals will also include a set of 15-Year Normals. This will help for people needing a shorter time frame reference. In California, we may see larger differences in the 15-year compared to the 30-year because of the historic drought from 2012-16.
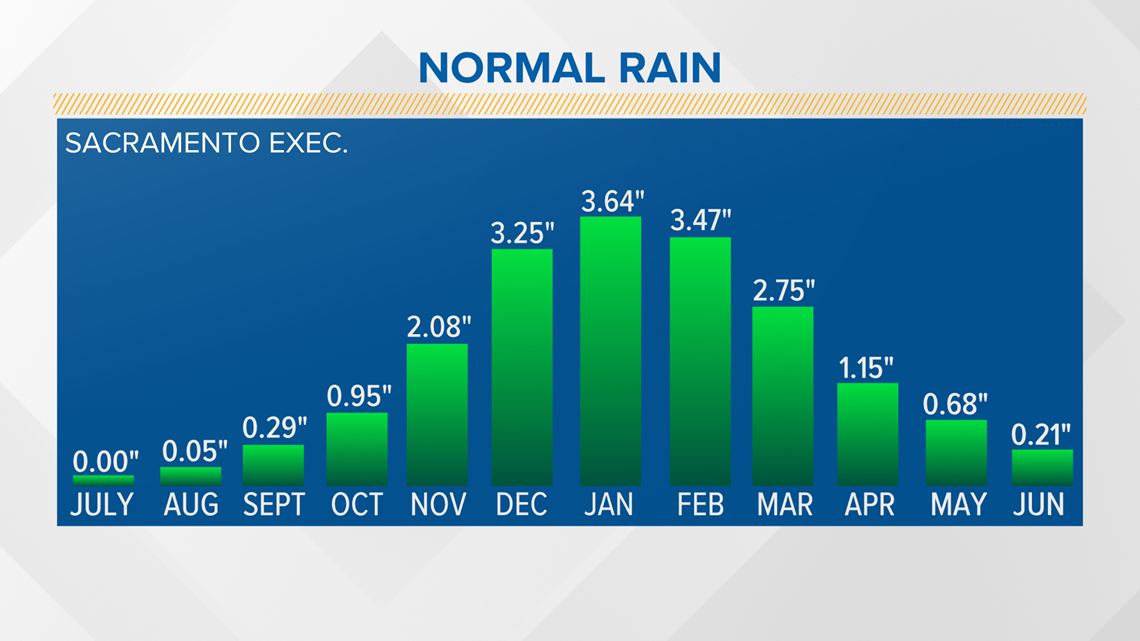
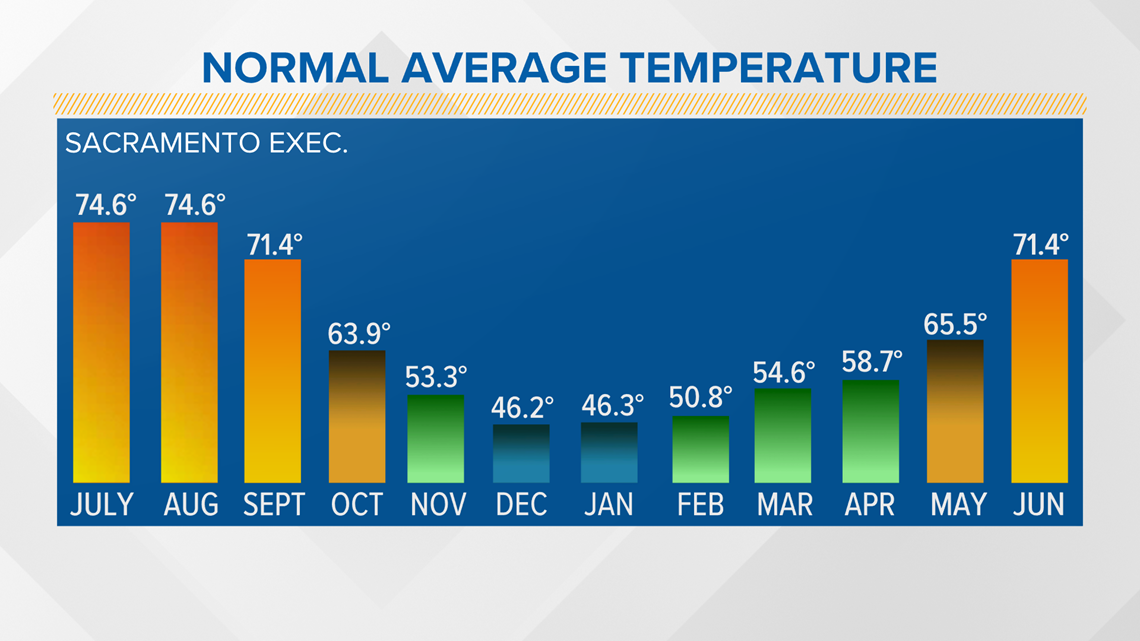
Here's a look at the current 1981-2010 Normal Rainfall and Average Monthly Temperature for Sacramento Executive monitoring station.