
WASHINGTON, D.C., USA — The U.S. became more diverse and more urban over the past decade, and the non-Hispanic white population dropped for the first time on record.
That's according to the Census Bureau, which on Thursday released a trove of demographic data that will be used to redraw the nation’s political maps.
The new figures offered the most detailed portrait yet of how the country has changed since 2010, and they are sure to set off an intense partisan battle over representation at a time of deep national division and fights over voting rights.
The figures show continued migration to the South and West at the expense of counties in the Midwest and Northeast.
This digital map shows change in U.S. population on the county level over the last decade:
This digital map outlines the redistricting process for each state, how many congressional seats are at stake and identifies which political party currently has the most influence over the matter. This map will be periodically updated.
This digital map outlines the redistricting process for each state, how many state legislative seats are at stake and identifies which political party currently has the most influence over the matter. This map will be periodically updated.
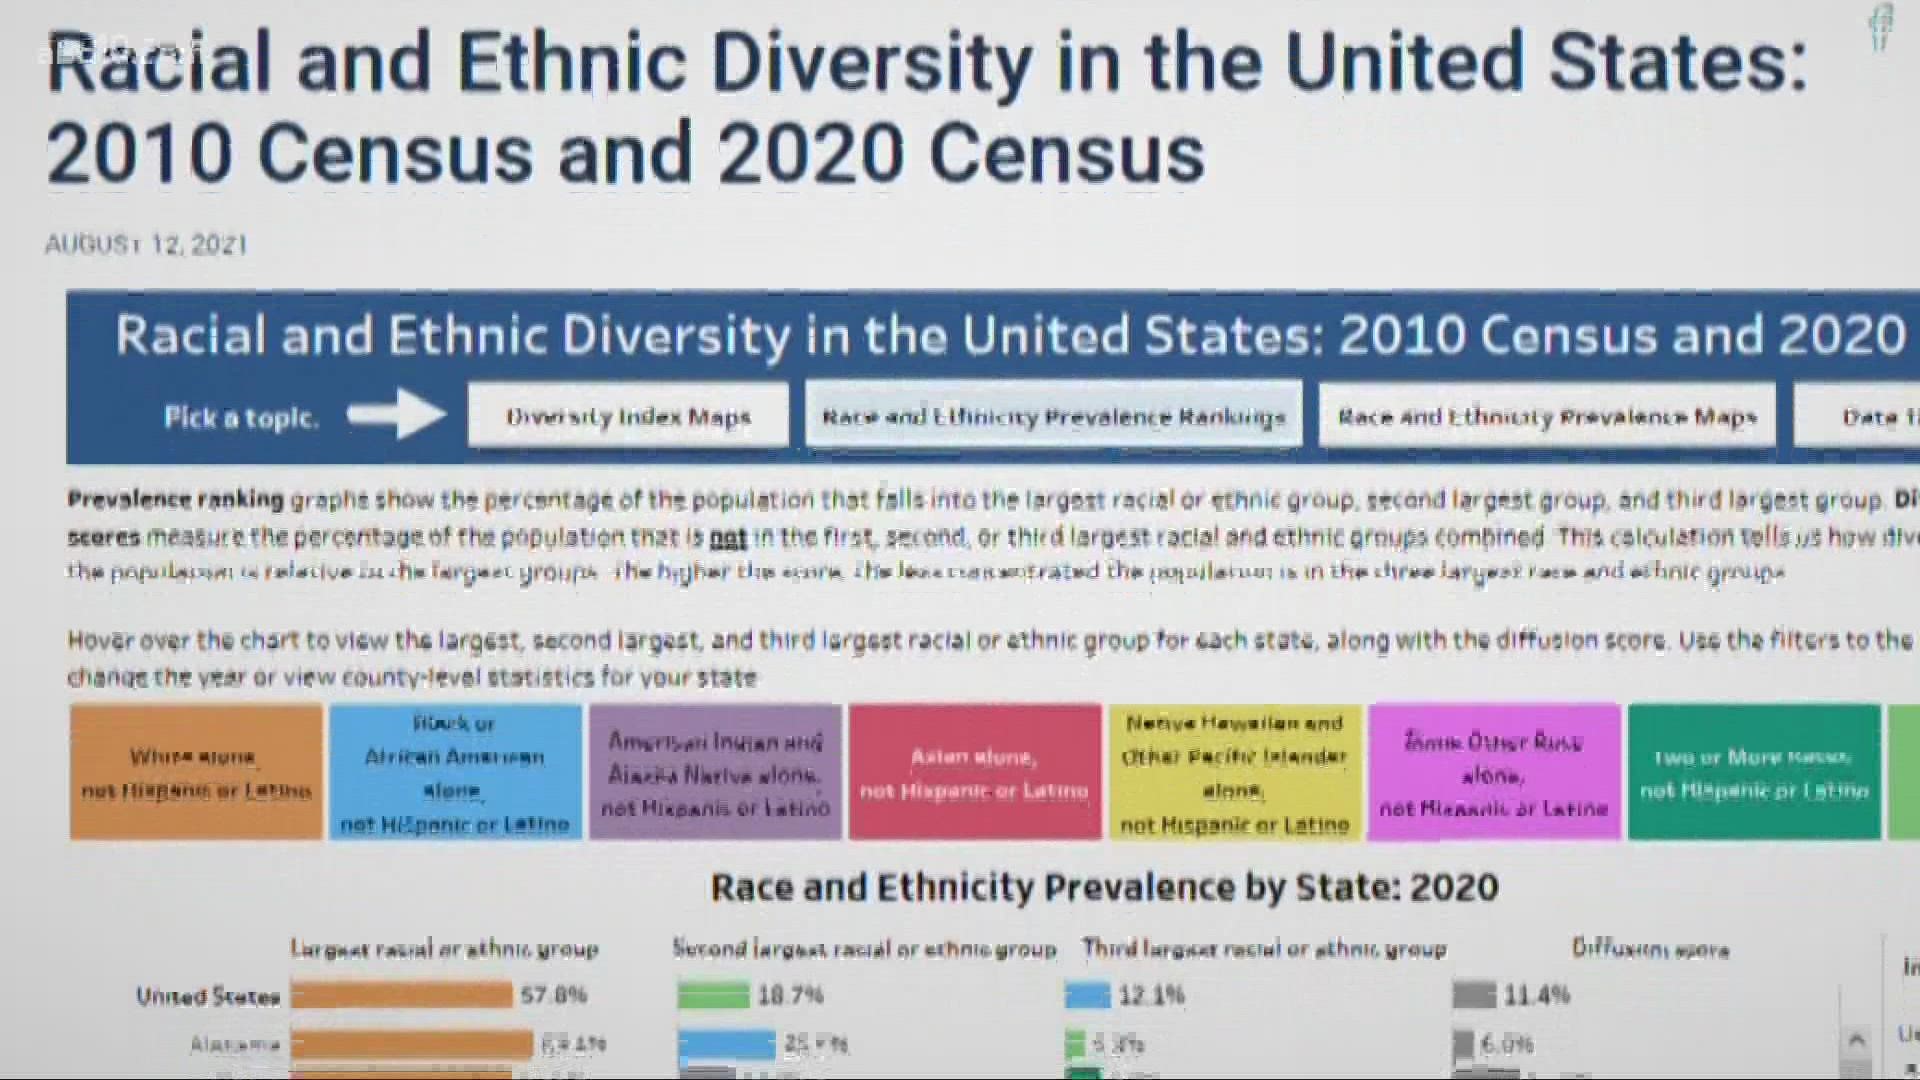
WATCH MORE: The U.S. Census Bureau holds a news conference to discuss the release of the first local level results from the 2020 Census. States use these data on race, Hispanic origin, and the voting-age population to redraw the boundaries of their congressional and state legislative districts.